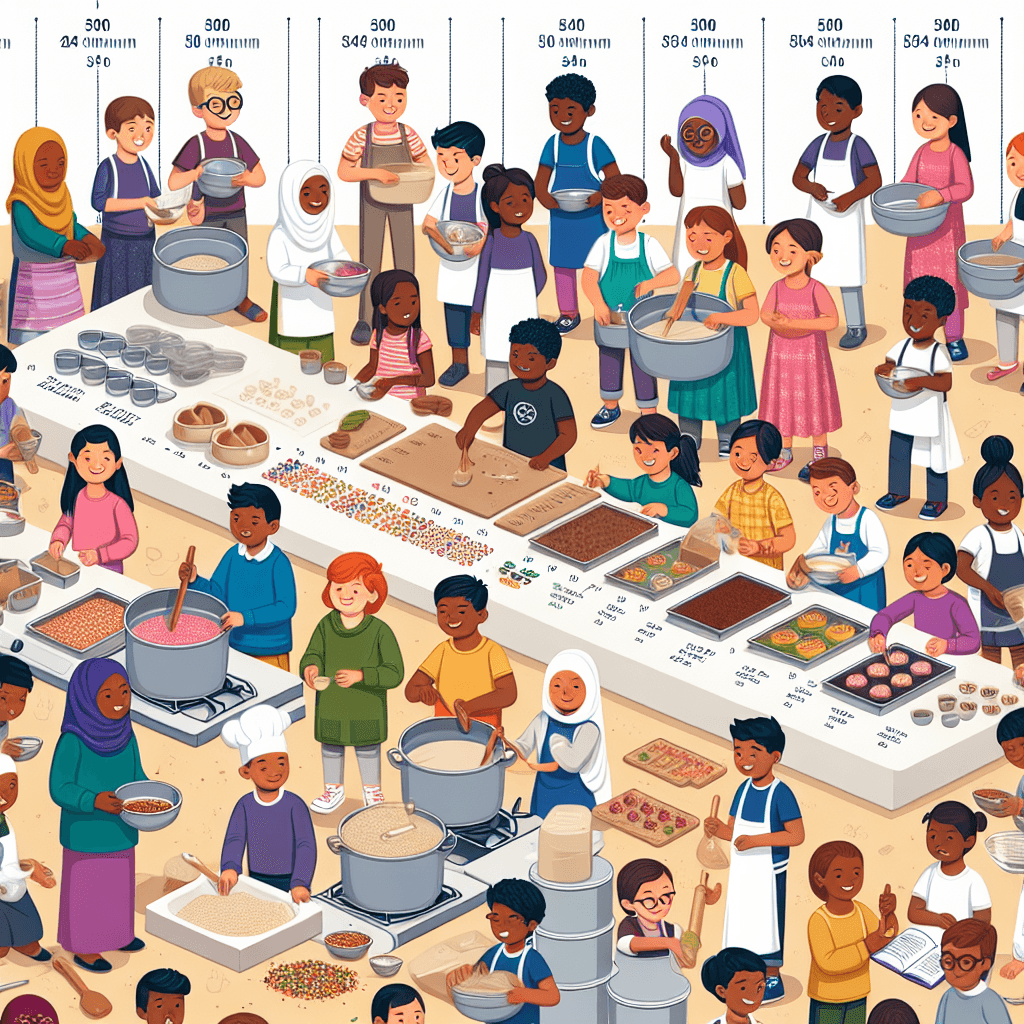
Recipe Re-Mix: Scaling Proportions for Five Hundred Students
Inquiry Framework
Question Framework
Driving Question
The overarching question that guides the entire project.How can we, as culinary mathematicians, re-mix a small-scale recipe into a budget-friendly feast for 500 students while maintaining precise nutritional balance?Essential Questions
Supporting questions that break down major concepts.- How does a ratio describe the relationship between different ingredients in a recipe, and why must that relationship stay the same when scaling?
- How can we use scale factors and proportional reasoning to increase a single-serving recipe to feed 500 people?
- How do unit rates help us compare costs and ensure our large-scale meal stays within a specific budget?
- How can we use percentages or ratios to verify that our meal maintains precise nutritional requirements (like protein-to-carb ratios) at any scale?
- What mathematical strategies can we use to convert measurements (e.g., teaspoons to gallons) to make our recipe practical for a cafeteria kitchen?
Standards & Learning Goals
Learning Goals
By the end of this project, students will be able to:- Apply proportional reasoning and scale factors to accurately increase a single-serving recipe to feed 500 individuals without altering the ratio of ingredients.
- Calculate unit rates for various ingredients to perform cost-benefit analysis and ensure the total meal cost remains within a specified budget.
- Convert units of measurement (e.g., teaspoons to cups, ounces to pounds) using ratio reasoning to make recipes practical for industrial kitchen production.
- Analyze nutritional data to maintain specific ratios (such as protein-to-carbohydrate) and represent these relationships using percentages or simplified ratios.
Common Core State Standards for Mathematics
Entry Events
Events that will be used to introduce the project to studentsThe Kantin Sekolah Budget Crisis
The school’s Pengusaha Kantin (Canteen Operator) issues an urgent memo: the price of 'ayam' and 'telur' has increased, but the budget for the school’s 'Rancangan Makanan Tambahan' (RMT) remains the same. Students are tasked with re-engineering a standard Nasi Lemak recipe to feed 500 students. They must calculate the exact kilograms of rice and grams of 'ikan bilis' needed to keep the taste authentic while ensuring the total cost per plate does not exceed RM3.50.The Great Sirap Disaster
During a mock 'Hari Kantin' preparation, students are given a sample of 'Sirap Bandung' that was scaled incorrectly—it looks pink but tastes like plain water because the evaporated milk and rose syrup ratios were off. After tasting a perfect small-scale 200ml sample, students must use proportional reasoning to calculate the exact number of 1-liter milk tins and large bottles of syrup required to create a perfect 100-liter batch that serves 500 hungry students without wasting a single drop.The TikTok 'Menu Rahmah' Fact-Check
A viral TikTok influencer claims to have created a 'Mega Menu Rahmah' that can feed 500 people for only RM200. However, upon closer inspection, the nutritional ratios (protein-to-carbs) seem dangerously low. Students must 'fact-check' the influencer by calculating the unit price per gram of the ingredients and re-scaling the recipe to ensure it meets Malaysian nutritional guidelines while remaining affordable for a 500-person feast.Portfolio Activities
Portfolio Activities
These activities progressively build towards your learning goals, with each submission contributing to the student's final portfolio.Decoding the Recipe DNA
Before feeding 500 people, students must master the 'DNA' of their recipe. In this activity, students analyze a single-serving Nasi Lemak recipe and create a ratio table that shows the relationship between ingredients (e.g., rice, coconut milk, and water). They will practice simplifying these ratios to understand the core flavor profile that must be maintained throughout the project.Steps
Here is some basic scaffolding to help students complete the activity.Final Product
What students will submit as the final product of the activityA 'Recipe DNA' Table that lists the simplified ratios for every ingredient in a single serving and an equivalent 10-serving batch.Alignment
How this activity aligns with the learning objectives & standardsThis activity aligns with CCSS.MATH.CONTENT.6.RP.A.3 by requiring students to use ratio reasoning to create tables of equivalent ratios for a single serving versus a small batch.The Mega-Multiplier Challenge
Now that students have the 'DNA' of their recipe, they must scale it to feed the entire school. Students will identify the scale factor needed to go from 1 serving to 500 servings. Using tape diagrams or double number line diagrams, they will calculate the massive quantities of ingredients required, ensuring the ratio between ingredients remains identical to the original small-scale version.Steps
Here is some basic scaffolding to help students complete the activity.Final Product
What students will submit as the final product of the activityA 'Feast for 500' Master Sheet, featuring visual models (like tape diagrams) that prove the proportions are correct.Alignment
How this activity aligns with the learning objectives & standardsThis activity aligns with CCSS.MATH.CONTENT.6.RP.A.3 by applying proportional reasoning to solve a large-scale real-world problem using scale factors.The Industrial Measurement Swap
Large-scale kitchens don't use teaspoons or small cups; they use kilograms and liters. In this activity, students convert their 500-person ingredient list into industrial-sized units. They will use conversion ratios (e.g., 1000g = 1kg) to ensure their order form is practical for a canteen operator to purchase from a wholesaler.Steps
Here is some basic scaffolding to help students complete the activity.Final Product
What students will submit as the final product of the activityThe 'Wholesale Order Form'—a professional document listing all ingredients in large-scale metric units (kg, L) rather than household units.Alignment
How this activity aligns with the learning objectives & standardsThis activity aligns with CCSS.MATH.CONTENT.6.RP.A.3.D, focusing on converting measurement units using ratio reasoning and manipulating units during multiplication.The Canteen Budget Audit
With the ingredient list ready, students must now face the 'Kantin Budget Crisis.' Using current market prices for 'ayam,' 'telur,' and rice, students will calculate the unit rate (cost per gram or per kg) for each item. They must then calculate the total cost for 500 people and ensure the cost per plate does not exceed the RM 3.50 limit set by the school.Steps
Here is some basic scaffolding to help students complete the activity.Final Product
What students will submit as the final product of the activityThe 'Budget-Friendly Banquet' Analysis, which includes a cost breakdown per ingredient and a final 'Price per Plate' calculation.Alignment
How this activity aligns with the learning objectives & standardsThis activity aligns with CCSS.MATH.CONTENT.6.RP.A.2, as students must understand and apply the concept of unit rates to calculate costs per serving and total budget.The Menu Rahmah Fact-Check
The final step is to ensure the 'Mega Menu' is healthy. Students will use the protein-to-carbohydrate ratio guidelines provided by Malaysian nutritional standards. They will calculate what percentage of their 500-person meal comes from protein versus carbs and compare it to the 'Menu Rahmah' standards to ensure their recipe isn't just cheap, but also nutritious.Steps
Here is some basic scaffolding to help students complete the activity.Final Product
What students will submit as the final product of the activityA 'Nutritional Fact-Check' Infographic that uses percentages and ratios to prove the meal is balanced for 500 students.Alignment
How this activity aligns with the learning objectives & standardsThis activity aligns with CCSS.MATH.CONTENT.6.RP.A.3.C, as students solve problems involving finding percentages of a quantity to verify nutritional balance.Rubric & Reflection
Portfolio Rubric
Grading criteria for assessing the overall project portfolioThe Culinary Mathematician's Portfolio Rubric
Mathematical Scaling and Ratio Application
This category focuses on the core mathematical application of ratios, scale factors, and unit conversions as applied to the Nasi Lemak recipe scaling.Proportional Scaling & Modeling
Assessment of the ability to identify base ratios and apply a scale factor of 500 to maintain flavor and texture consistency.
Exemplary
4 PointsAccurately identifies the 'Recipe DNA' with simplified ratios; uses scale factors and visual models (tape diagrams/number lines) flawlessly to represent 500 servings. Provides a deep explanation of why the relationship between ingredients must remain constant.
Proficient
3 PointsIdentifies the base ratios correctly and applies the scale factor of 500 to all ingredients. Visual models like tape diagrams are used correctly to represent the increase in quantity.
Developing
2 PointsIdentifies ratios but makes minor errors in scaling some ingredients. Visual models are present but may contain inaccuracies or lack clear labeling.
Beginning
1 PointsStruggles to identify base ratios or apply a scale factor. Scaling is inconsistent, leading to a recipe that would not maintain its original 'DNA' or flavor profile.
Industrial Measurement & Unit Conversion
Evaluation of the student's ability to use ratio reasoning to convert household measurements (tsp, cups, ml) into industrial/wholesale units (kg, L) for the 500-person order form.
Exemplary
4 PointsDemonstrates sophisticated unit conversion across all ingredients; uses 'back-calculation' to verify accuracy and ensures the wholesale order is perfectly practical for an industrial kitchen. Precision is absolute.
Proficient
3 PointsCorrectly converts all recipe quantities from household to metric industrial units (g to kg, ml to L) using ratio reasoning. The order form is functional and accurate.
Developing
2 PointsShows an understanding of unit conversion but makes calculation errors or uses inappropriate units for an industrial kitchen (e.g., ordering 500 teaspoons instead of kilograms).
Beginning
1 PointsProvides incorrect or incomplete conversions. Shows significant confusion between units of weight and volume or fails to use ratio reasoning for conversions.
Real-World Economic & Health Analysis
This category evaluates the application of math to real-world constraints: financial budgeting and nutritional health standards.Unit Rate & Budget Management
Assessment of the student's ability to determine unit rates (cost per unit) and calculate the total and 'per plate' cost to meet the RM 3.50 target.
Exemplary
4 PointsCalculates precise unit rates for all ingredients; provides a sophisticated budget analysis that hits the RM 3.50 target while offering insights into cost-saving strategies without sacrificing quality.
Proficient
3 PointsAccurately calculates unit rates and total costs for 500 servings. The final 'Price per Plate' is calculated correctly and meets the budget constraints of the project.
Developing
2 PointsCalculates costs with minor errors. May struggle to find the unit rate or correctly divide the total cost by 500 to find the cost per plate. Budget may be slightly exceeded.
Beginning
1 PointsFails to calculate unit rates or total costs accurately. The budget analysis is incomplete or shows significant mathematical errors that make the project unfeasible.
Nutritional Analysis & Data Representation
Evaluation of the ability to calculate percentages of quantities and represent nutritional ratios to verify balance against standards.
Exemplary
4 PointsCreates a professional infographic showing precise protein-to-carb ratios and percentages. Provides a compelling, evidence-based justification for why the meal meets nutritional guidelines compared to the 'Menu Rahmah'.
Proficient
3 PointsCorrectly calculates the percentage of protein and carbohydrates in the meal. The infographic clearly shows the ratios and accurately compares them to the provided nutritional guidelines.
Developing
2 PointsAttempts to calculate percentages and ratios but contains errors. The comparison to nutritional guidelines is vague or lacks specific mathematical evidence.
Beginning
1 PointsFails to calculate percentages or ratios for nutrition. The infographic is missing or does not provide a mathematical basis for the health claims of the meal.
Mathematical Inquiry & Reflection
This category measures the student's ability to communicate their mathematical thinking and reflect on the learning journey.Metacognition & Mathematical Communication
Assessing the student's ability to reflect on their mathematical process, explain their choices, and refine their work based on the inquiry framework.
Exemplary
4 PointsReflections show a deep growth mindset; student explains how they identified and corrected errors during the 'back-calculation' phase and offers innovative solutions to the budget crisis.
Proficient
3 PointsProvides clear explanations for the mathematical strategies used (scale factors, unit rates). Effectively answers the essential questions through the final portfolio products.
Developing
2 PointsExplanations are present but brief. Student shows a basic understanding of the 'how' but struggles to explain the 'why' behind their mathematical choices.
Beginning
1 PointsMinimal reflection or explanation provided. Portfolio lacks evidence of the student's thinking process or engagement with the driving inquiry question.