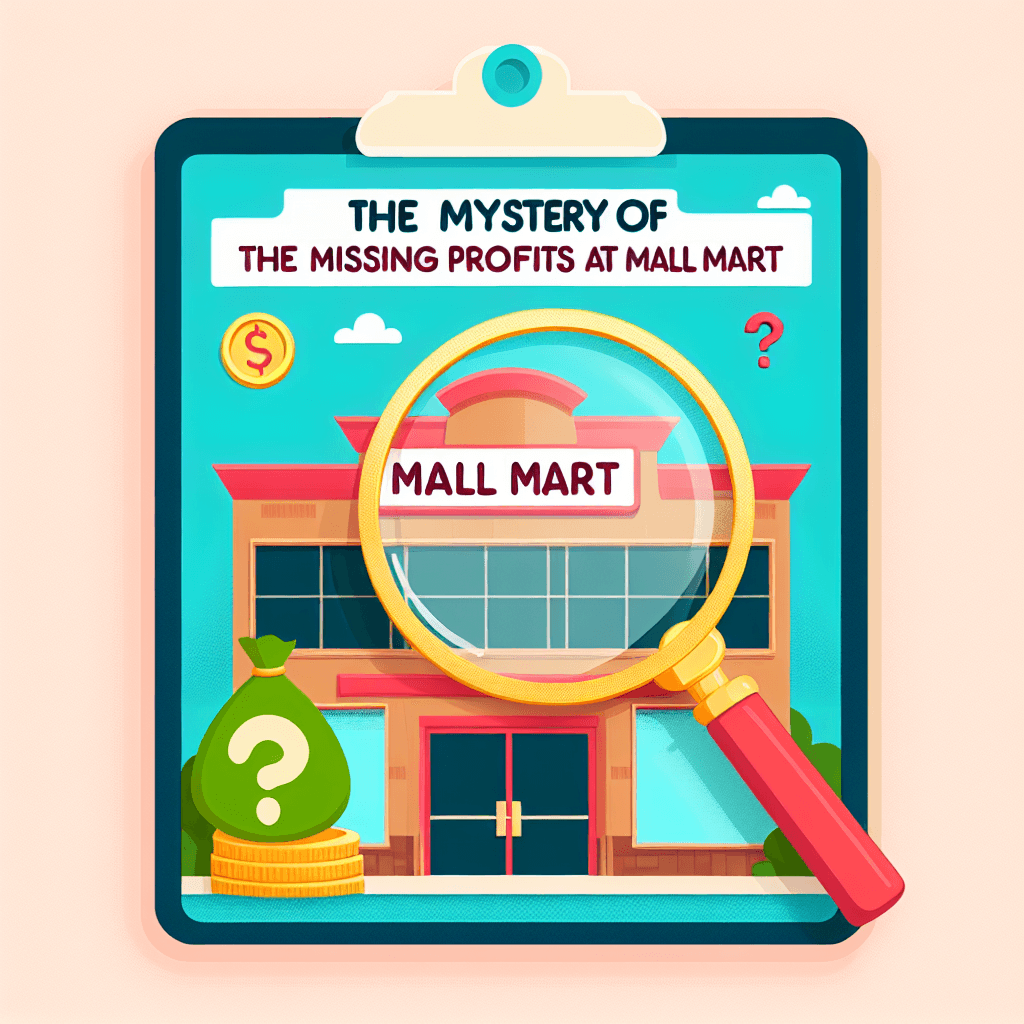
The Mystery of the Missing Profits at Mall Mart
Inquiry Framework
Question Framework
Driving Question
The overarching question that guides the entire project.How can we, as student detectives, use data to uncover the hidden factors contributing to the mysterious decline in Mall Mart's profits, and what solutions can we propose to address these challenges?Essential Questions
Supporting questions that break down major concepts.- What are the potential reasons for declining profits in a business despite steady sales?
- How can data be used to identify patterns and anomalies in business operations?
- What processes are involved in tracking returns, inventory, and sales in a retail setting?
- How can discrepancies in systems and processes impact a business's profit margins?
- In what ways can employee schedules influence operational outcomes in a business?
- How can systems thinking be applied to solve complex business problems?
- What role does management information systems (MIS) play in ensuring accurate business reporting and tracking?
- How does shrinkage affect inventory and how can it be detected or prevented?
- What are the ethical considerations when analyzing business operations data?
- How can recommendations be developed from data analysis findings to improve business practices?
Standards & Learning Goals
Learning Goals
By the end of this project, students will be able to:- Students will be able to analyze sales and profit data to identify discrepancies and patterns affecting business performance.
- Students will develop skills in systems thinking by identifying gaps in operational processes and recommending improvements.
- Students will understand the role and functionality of management information systems in business operations.
- Students will gain experience in using data analysis to support business decisions and problem-solving.
- Students will apply ethical considerations when analyzing and interpreting business operations data.
- Students will communicate their findings and solutions effectively through data visualization and formal presentation.
Common Core Standards
Next Generation Science Standards
C3 Framework for Social Studies
ISTE Standards for Students
Entry Events
Events that will be used to introduce the project to studentsBreaking News Alert
A breaking news segment reports the mystery of Mall Mart's declining profits, interviewing 'experts' who provide conflicting theories. The news coverage, paired with interviews from concerned customers and a financial analyst, sets the stage for students to determine the accuracy of these theories through hands-on investigation.Portfolio Activities
Portfolio Activities
These activities progressively build towards your learning goals, with each submission contributing to the student's final portfolio.Clue Hunting Starter Kit
Students begin their journey into detecting the missing profits by identifying basic patterns within provided data. They'll start associating data points to understand what's normal and what's suspicious.Steps
Here is some basic scaffolding to help students complete the activity.Final Product
What students will submit as the final product of the activityA document recording initial clues and suspicious patterns indicating potential issues.Alignment
How this activity aligns with the learning objectives & standardsAligns with CCSS.MATH.CONTENT.8.SP.A.1 by constructing interpretations of scatter plots for sales data to identify patterns.Department Detective Dive
Students dive deeper into the department-level data to uncover inconsistencies and gather more focused insights into where the profits might be leaking.Steps
Here is some basic scaffolding to help students complete the activity.Final Product
What students will submit as the final product of the activityA set of department-specific charts and hypotheses outlining department inconsistencies.Alignment
How this activity aligns with the learning objectives & standardsAligns with NGSS.MS-ETS1-2 by encouraging evaluations of different departmental processes to uncover system inefficiencies.Tracking Troubleshooter
Students focus on understanding the gaps in the returns process within the Management Information Systems (MIS) and how these might be affecting profits.Steps
Here is some basic scaffolding to help students complete the activity.Final Product
What students will submit as the final product of the activityA report outlining the tracking deficiencies in the management information system with potential solutions.Alignment
How this activity aligns with the learning objectives & standardsAligns with ISTE.4.d by having students critically assess data and system relevance and accuracy.Solution Strategy Session
Students prepare to present their final conclusions and recommend solutions addressing the detected issues throughout the investigation.Steps
Here is some basic scaffolding to help students complete the activity.Final Product
What students will submit as the final product of the activityA multimedia presentation detailing the investigation process and proposed solutions.Alignment
How this activity aligns with the learning objectives & standardsAligns with CCSS.ELA-LITERACY.SL.8.5 by including multimedia components to clarify claims and CCSS.ELA-LITERACY.W.8.1 by constructing written arguments with evidence.Rubric & Reflection
Portfolio Rubric
Grading criteria for assessing the overall project portfolioMall Mart Mystery Investigation Rubric
Data Analysis and Interpretation
Assessment of students' proficiency in analyzing and interpreting data to identify patterns, discrepancies, and potential issues affecting business performance.Pattern Identification
Ability to accurately identify patterns and discrepancies in sales, inventory, and returns data.
Exemplary
4 PointsDemonstrates a sophisticated ability to identify complex patterns and discrepancies across all data sets with a high degree of accuracy and insight.
Proficient
3 PointsIdentifies key patterns and discrepancies with clarity, showing effective analysis of the provided data.
Developing
2 PointsShows an emerging ability to identify patterns, with some accuracy in analysis but occasional inconsistencies.
Beginning
1 PointsStruggles to identify relevant patterns, with limited analysis and frequent inaccuracies.
Use of Visual Tools
Effectiveness in using visual tools to represent data findings, such as graphs and charts.
Exemplary
4 PointsCreates sophisticated and insightful visual representations that clearly communicate complex data findings.
Proficient
3 PointsUses visual tools effectively to communicate data findings and support analysis.
Developing
2 PointsAttempts to use visual tools, but representations lack clarity or coherence.
Beginning
1 PointsMinimal use of visual tools, leading to poorly communicated data findings.
Critical Thinking and Systems Evaluation
Assessment of students' ability to apply critical thinking skills and evaluate system processes to identify inefficiencies and propose solutions.Systems Analysis
Ability to evaluate system processes to identify inefficiencies and propose realistic improvements.
Exemplary
4 PointsDisplays advanced critical analysis of system processes, with innovative and feasible improvement proposals.
Proficient
3 PointsConducts thorough evaluation of systems, proposing reasonable improvements.
Developing
2 PointsProvides basic evaluation of systems with some relevant proposals but lacks depth.
Beginning
1 PointsStruggles with systems evaluation, offering minimal or unclear proposals.
Hypothesis Development
Skill in forming hypotheses based on data analysis and systems evaluation.
Exemplary
4 PointsDevelops insightful and sophisticated hypotheses that are well-supported by evidence.
Proficient
3 PointsForms clear, evidence-based hypotheses that are logically sound.
Developing
2 PointsAttempts to form hypotheses, but they are vague or inadequately supported by evidence.
Beginning
1 PointsStruggles to form coherent hypotheses, providing minimal evidence or rationale.
Effective Communication and Presentation
Evaluation of students' ability to communicate their findings and solutions effectively through various media and presentations.Clarity of Presentation
Ability to deliver a clear, cohesive, and engaging presentation using multimedia tools.
Exemplary
4 PointsDelivers a compelling and well-structured presentation with sophisticated use of multimedia elements.
Proficient
3 PointsPresents information clearly and effectively, using multimedia tools to enhance communication.
Developing
2 PointsPresentation conveys basic information but lacks clarity or effective use of multimedia.
Beginning
1 PointsPresentation is unclear and lacks effective organization and multimedia integration.
Argument Development
Skill in constructing well-supported arguments and recommendations based on data analysis.
Exemplary
4 PointsConstructs highly persuasive arguments with extensive evidence, showing deep understanding and insight.
Proficient
3 PointsDevelops logical and well-supported arguments with clear evidence.
Developing
2 PointsAttempts arguments but lacking in clarity, coherence, or sufficient evidence.
Beginning
1 PointsStruggles to form coherent arguments with minimal supporting evidence.